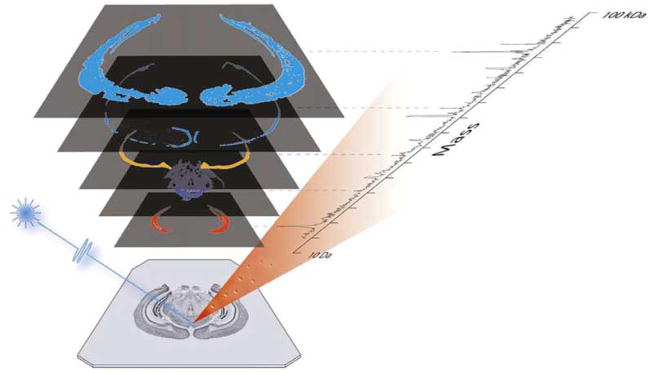
Figure 1.
Overview of MSI. A series of complete mass spectra are taken in an ordered array across the sample. The intensity of the signal for selected compounds of interest are then plotted following data acquisition to create a series of ion images. (Reprinted with permission from reference (Rohner et al. 2005).)

