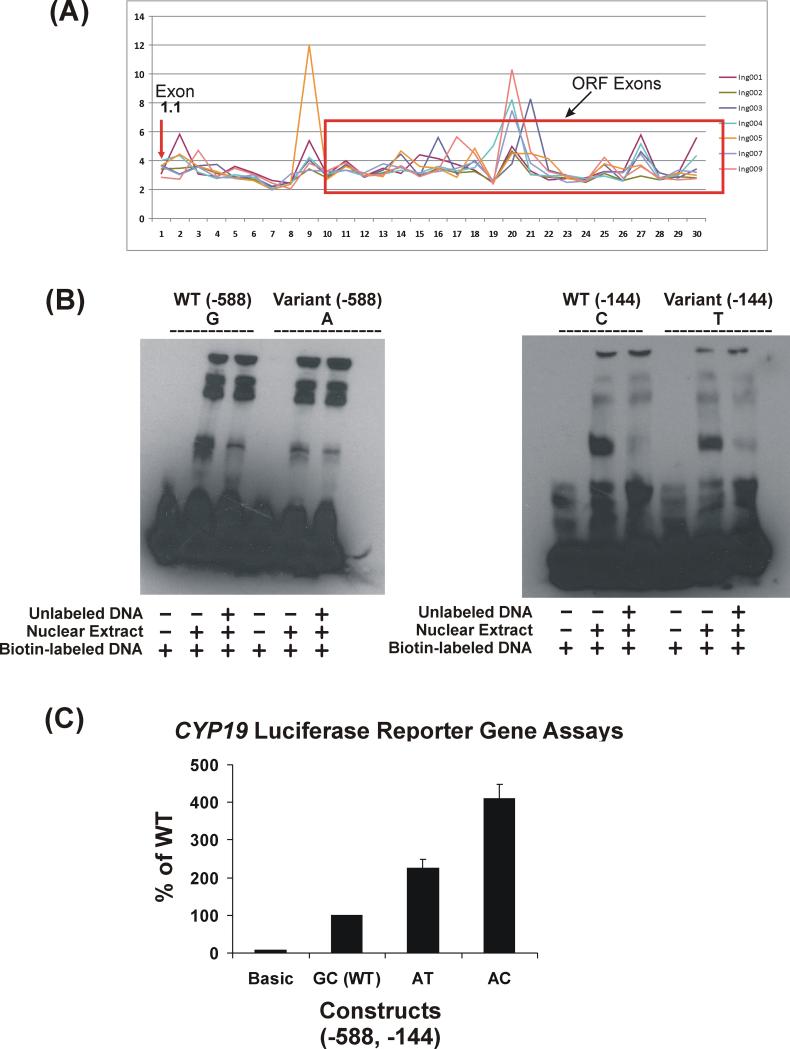
Figure 4.
Functional characterization of CYP19 rs6493497 (−588) and rs7176005 (−144). (A) Exon array analysis of CYP19 expression in 7 breast tumor samples. Exon array probe sets (1-30) for CYP19 are plotted against expression levels. The arrow indicates probe sets for exon 1.1. The red rectangular box indicates the coding region of the gene. The cutoff for the expression level is 3. (B) EMSA of SNPs at (−588) and (−144) upstream of exon 1.1. EMSA were performed using biotin-labeled probes containing WT or variant sequences using nuclear extract from SKBR03 Cells. Competition reactions were performed with 400-fold excess of unlabeled probes. (C) Reporter gene assays. Reporter gene constructs were created for WT (GC) and the observed haplotypes (AT and AC) for the rs6493497 and rs7176005 SNPs. Luciferase activity was corrected for Renilla luciferase activity and is expressed as a percent of the WT activity. Values are mean ± SEM for 3 independent experiments.

