
Figure 5. Association heat maps showing union of gene sets enriched for both BRCA1 and BRCA2 in breast and ovary heterozygous cells.
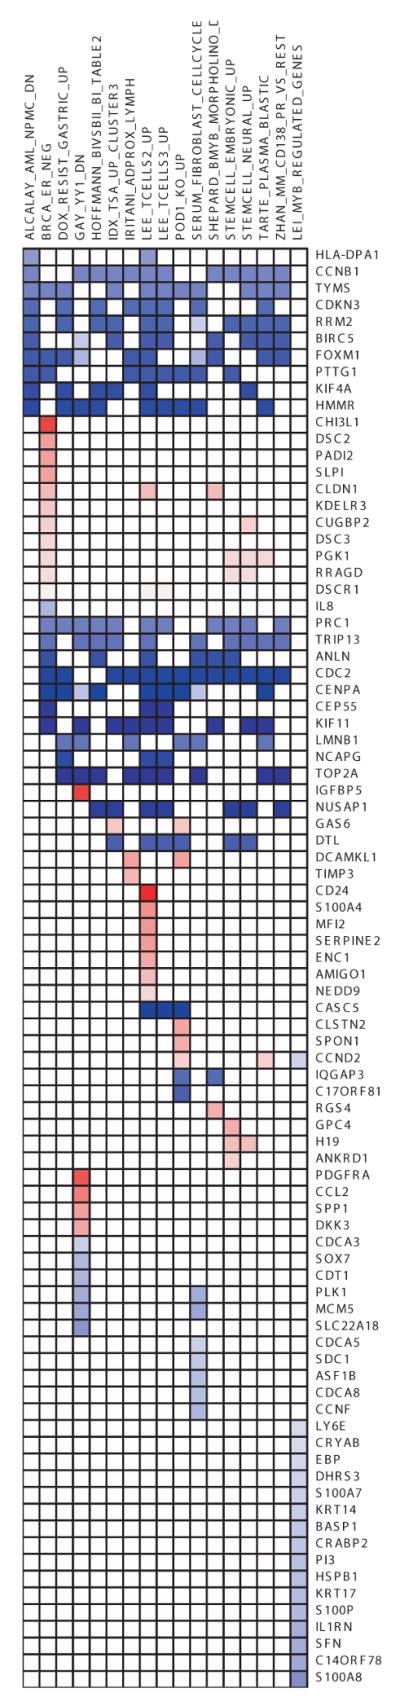
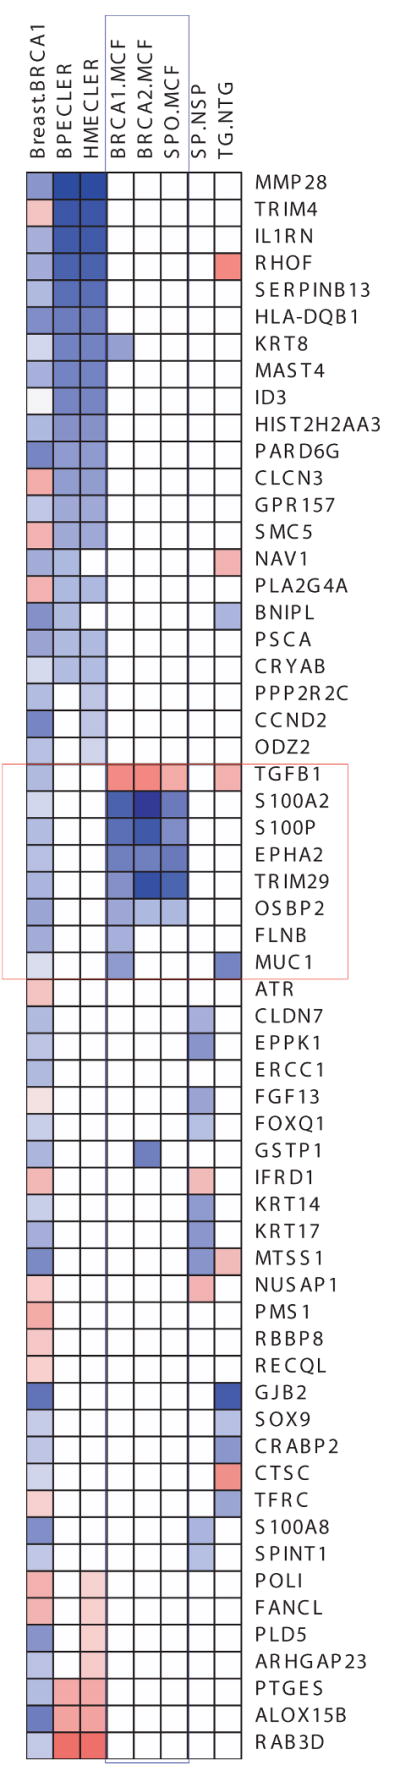
Each row represents a gene whereas columns are gene sets enriched. Blue color indicates that the genes are down-regulated and red color indicates up-regulation. A, Association heatmap of genes in common between the indicated datasets (listed in Table S3) and primary breast BRCA1 and BRCA2 mutant cells. B, Association heatmap of genes in common between transformed human mammary epithelial cells (HMECs) and primary breast BRCA1 and BRCA2 heterozygous cells. In this figure HMEC refers to genes differentially expressed between HMEC-transformed (HMLER) vs. parental HMEC cells. Blue color indicates the down-regulation and red color indicates up-regulation. Breast.BRCA1 column indicates genes differentially expressed in BRCA1 heterozygous cells from breast. SP.NSP indicates differentially expressed genes between mouse mammary side population and non-side population cells (22). TG.NTG column indicate genes differentially expressed between mouse cancer stem cells and non cancerous stem cells (24). Columns in blue box (BRCA1.MCF, BRCA2.MCF and SPO.MCF) are differentially expressed gene sets from Hedenfalk et.al. Genes in red box indicate the genes common to Hedenfalk and Breast.BRCA1.