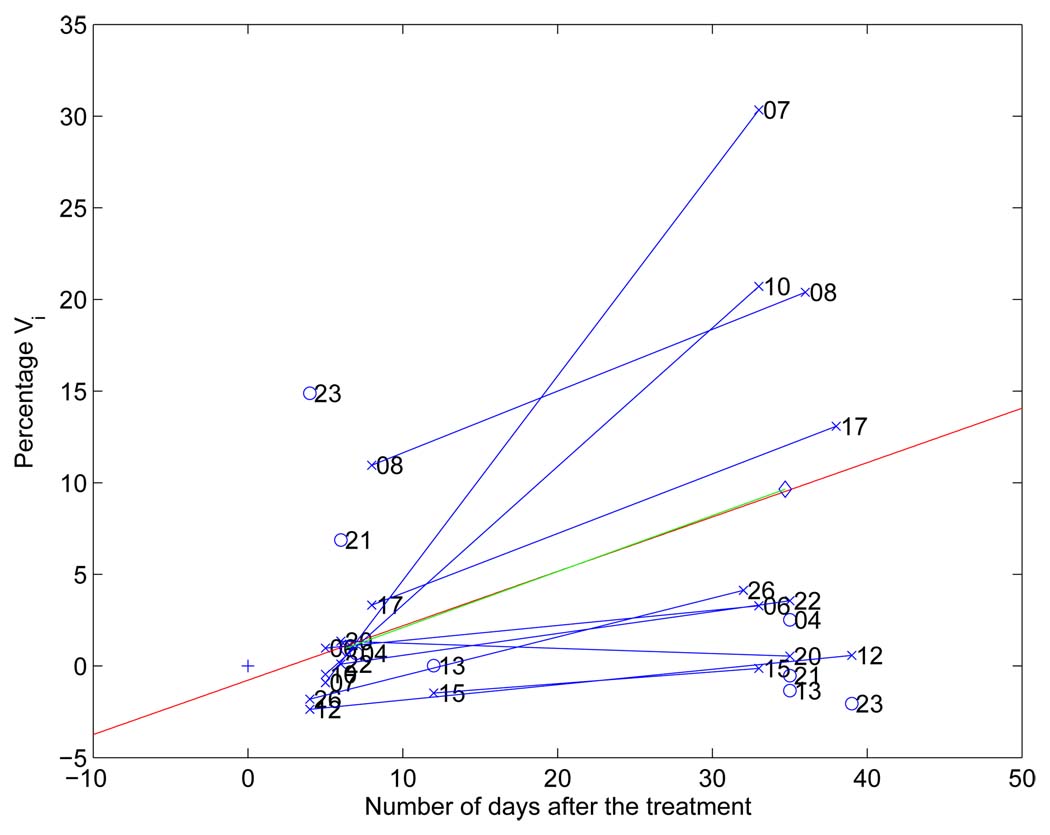
Fig. 4.
Percentage_Vi versus number of days after the initiation of treatment. The red line represents linear regression of all (percentage_Vi, number of days after treatment) pairs. A blue line connects the two different time points for each patient. The (0, 0) point is plotted with a ”+”; Ideally after a zero length time interval there should be no measured response to therapy.

