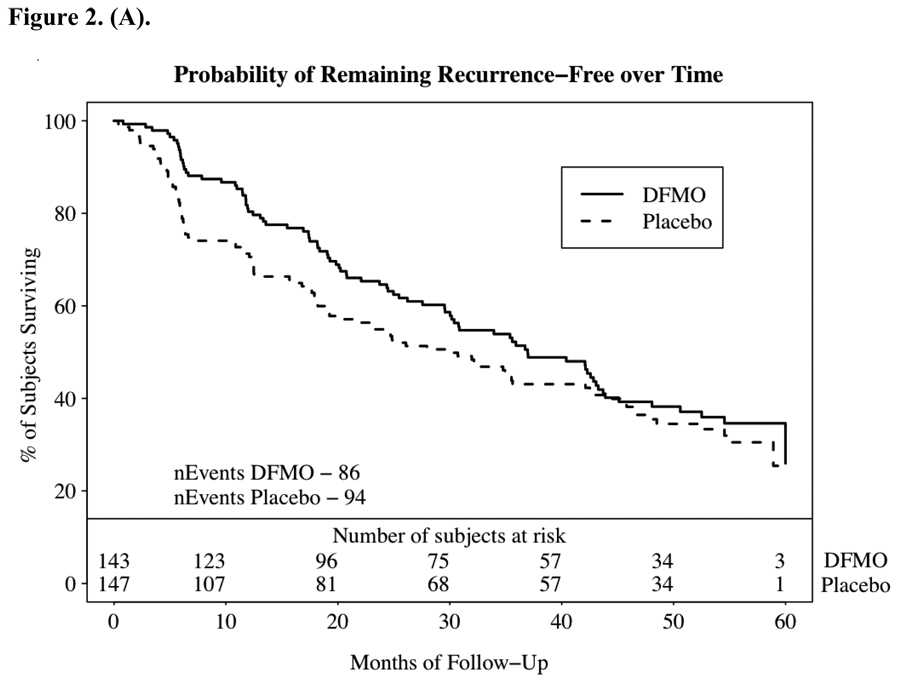
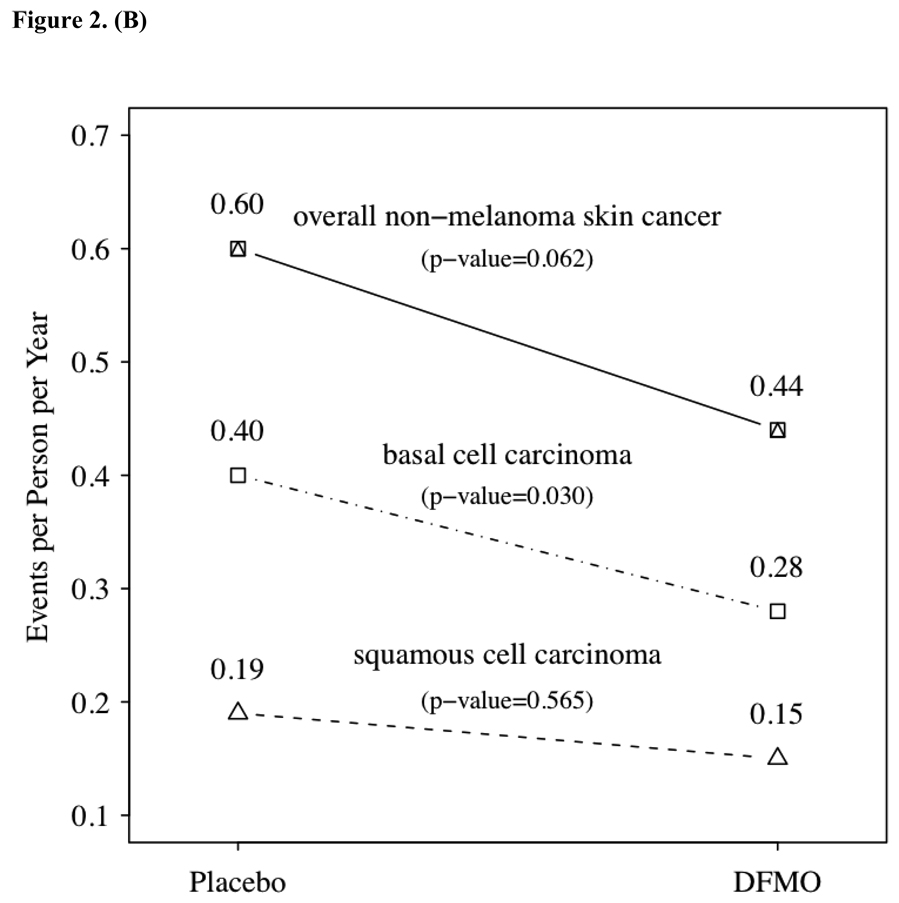
Figure 2.
2a – Probability of remaining recurrence free over time as indicated by the Kaplan-Meier estimator. Time to first non-melanoma skin cancer (NMSC) in study. Time to first diagnosis was computed from the date of first new skin cancer diagnosis after randomization, and the randomization date. Panel displays a Kaplan-Meier curve of the probability of remaining recurrence-free over time. Numbers at the bottom are the number of subjects per treatment group still at risk. Patients with no new skin cancers reported were censored at the date of the last study visit in the follow-up database: 2b – non-melanoma skin cancer event rate by treatment group and histology. P values were obtained from over dispersed Poisson models considering the cumulative counts of new cancer over time within each subject, with treatment as the independent variable.


