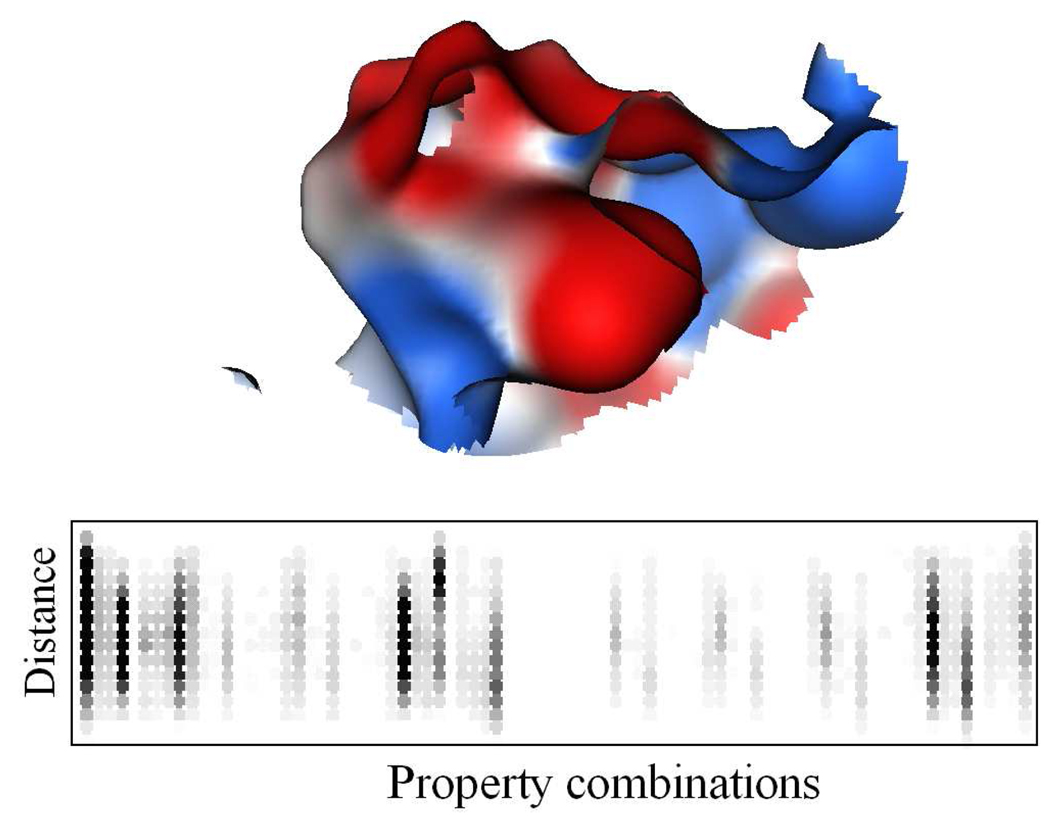
Figure 1.
Electrostatic potential mapped binding site surface of protein neuraminidase (PDB: 1f8b) from influenza virus and the graphical representation of the corresponding PESD signature below it. Each circle represents a bin. Empty bins are white while bins containing non-zero values are represented by various sheds of grey. Any bin having value ≥ 400 is drawn black. PESD property combinations change by columns and point-pair distances increase by rows from top to bottom.

