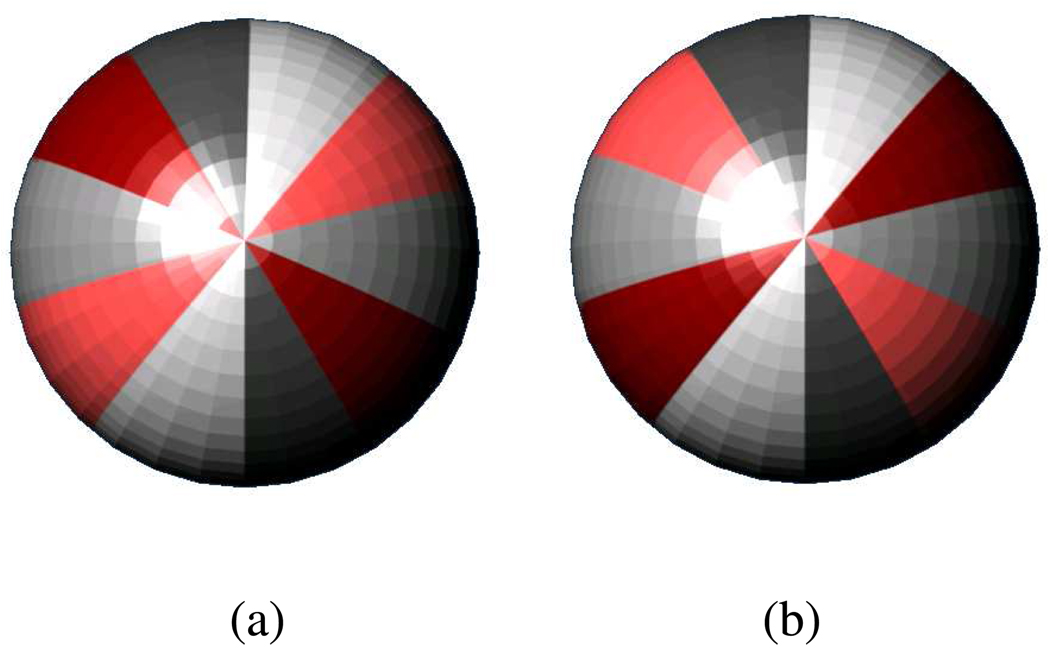
Figure 9.
The different shades of grey represent different magnitudes of a single property with a positive sign and different shades of red represent varying magnitudes of the same property with a negative sign. The Figures 9a and 9b are different in that the order of variation in magnitude of negative properties is reverse with respect to the order of variation of positive properties.

