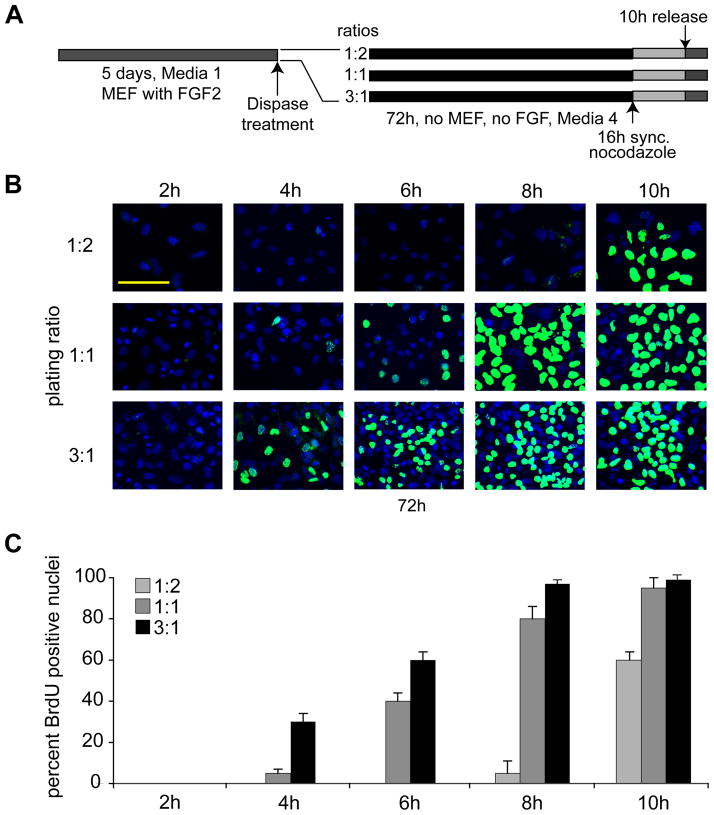
Figure 3. Lengthening of the G1 phase in human ES cells depends on cell density.
(A) Experimental design. (B) Human ES cells were seeded in differentiating media under feeder-free and conditions at low (1:2), medium (1:1), and high density (3:1) for 72 h. These ratios reflect the split of the original culture. In a split of 1:2, colonies from one plate were divided into two, a 3:1 ratio means that colonies from three plates were pooled into one plate. At 72 h, cells were mitotically arrested using nocodazole for an additional 16 h, and cell cycle progression was monitored using immunofluorescence detection of BrdU incorporation at 2 h, 4 h, 6 h, 8 h, and 10 h after mitotic release (Scale bar = 100 μm). (C) Quantitation of the fraction of BrdU labeled nuclei at the indicated time points after culture at different plating densities (as reflected by split ratios). The quantitation is based on two independent experiments performed in duplicate in which 400 nuclei were counted (n=1600; error bars = SEM).

