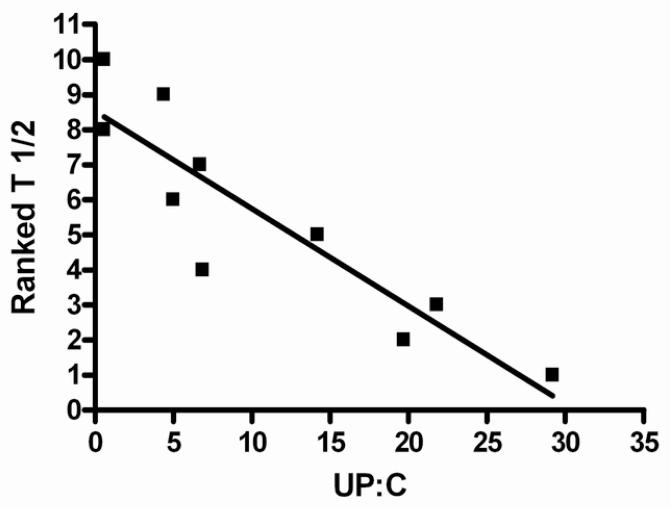
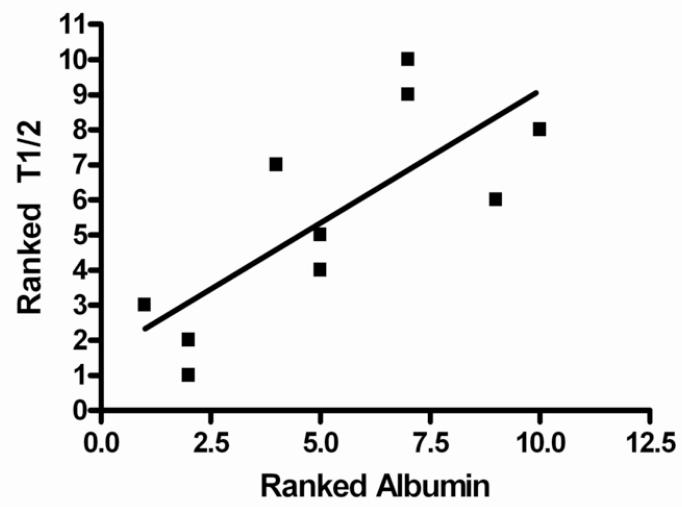
Figures 3a and 3b.
3a: Linear regression model of ranked T½ versus UP:C (urine protein-creatinine ratio) at steady state. Data were ranked so that they would follow a normal distribution. The model resulted in r = −0.8990 (95% Confidence Interval −0.9761 to −0.6207), r2 −0.6207, p<0.001.
3b: Linear regression model of ranked T½ versus ranked serum albumin at steady state. Data were ranked so that they would follow a normal distribution. The model resulted in r = 0.7586 (95% Confidence Interval 0.2467 to 0.9395), r2 0.5755, p=0.01


