Figure 11.

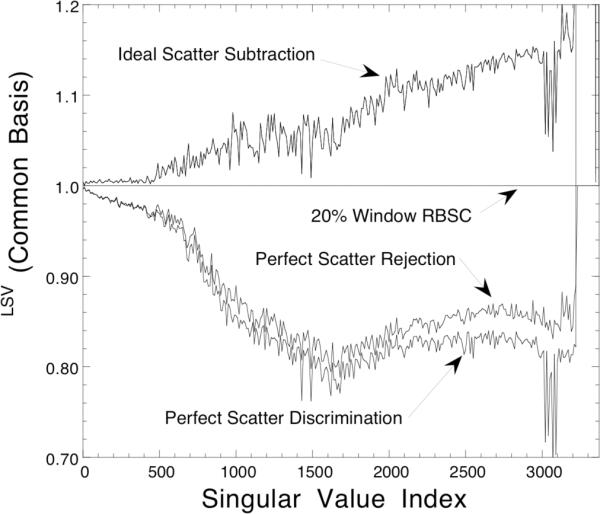
Variance spectra for each of the methods that use only photons from a 20% wide photopeak energy window. The spectra have been expressed using the common basis formed by the left singular vectors of the 20% Window RBSC design matrix.

Variance spectra for each of the methods that use only photons from a 20% wide photopeak energy window. The spectra have been expressed using the common basis formed by the left singular vectors of the 20% Window RBSC design matrix.