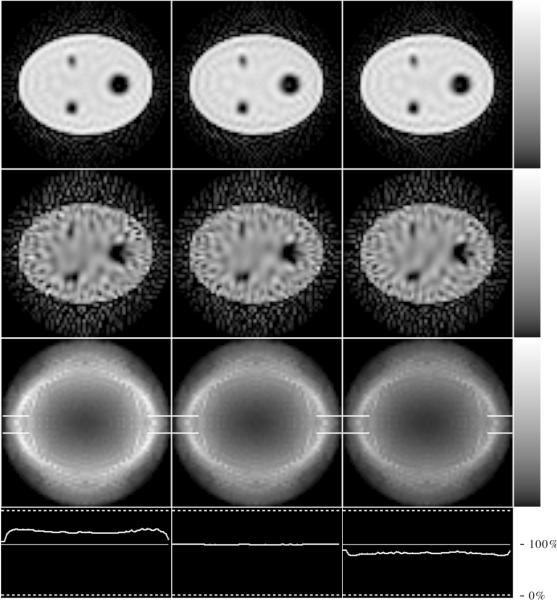
Figure 16.
Images for 49 keV Window RBSC (left), Dual Window RBSC (center), and Perfect Scatter Discrimination (right): noise-free data (top row), noisy data (second row), and variance images (third row). Horizontal profiles (bottom row) show the relative heights of these variance images (thick lines) relative to the “standard” 20% Window RBSC variance image (thin line). They were obtained by dividing these variance images by that for the 20% Window RBSC method, and then taking profiles across the resultant “relative” variance images. All images were regularized by including 2000 singular values in the W-GMI reconstruction, and the images of each row are displayed using the greyscales shown at the right.

