Figure 6.

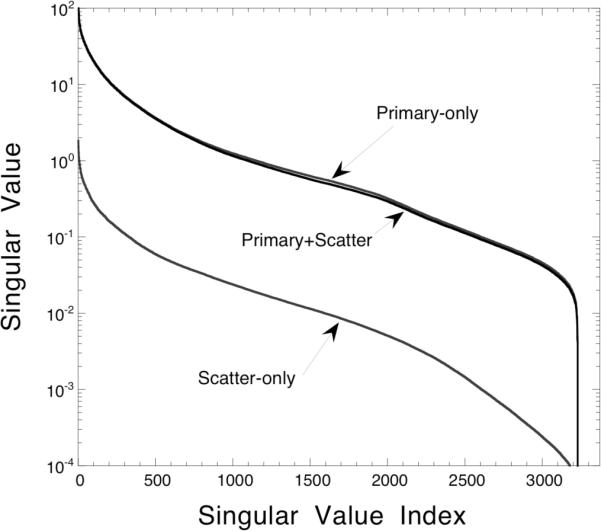
Singular value spectra for the primary-only, scatter-only, and primary plus scatter data using the 20% wide photopeak energy window. The vertical axis has been displayed using a logarithmic scale.

Singular value spectra for the primary-only, scatter-only, and primary plus scatter data using the 20% wide photopeak energy window. The vertical axis has been displayed using a logarithmic scale.