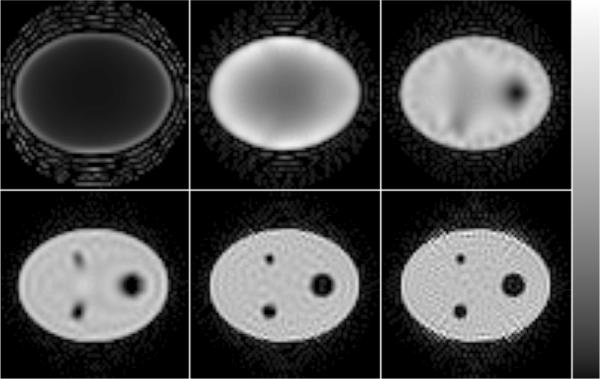
Figure 8.

Noise-free W-GMI reconstructions of the primary-only data (Perfect Scatter Rejection). The images were regularized by truncating the singular value spectrum at: (top row, left to right) 500, 1000, 1500; (bottom row) 2000, 2500 and 3000 singular values.
