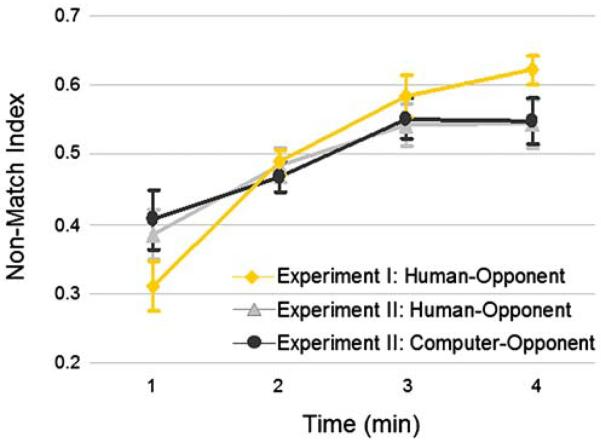
Fig. 2.
Players' choices as a function of time during experiments I and II. Non-match index (number of non-match choices divided by the number of non-match and match choices) for games played against human in experiment I (orange), and against human (light gray) and computer (dark gray) opponent in experiment II are plotted for each minute of the game (averaged for all games for all subjects). No significant differences were found between the two groups (experiment I and II) when playing against human and between human and computer opponents in experiment II

