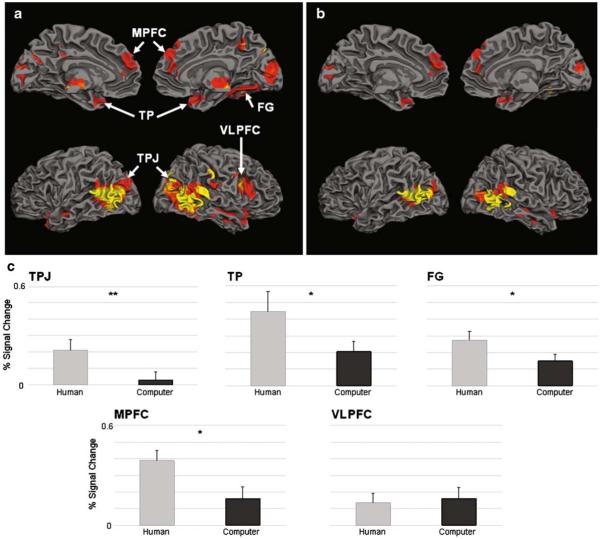
Fig. 4.
Mentalization network (experiment II). Activation map of random effects ANOVA showing brain regions with significant main effect of mentalization during the human-opponent runs (n=18, q(FDR)<0.05). Notably, these brain regions are almost identical to the brain regions activated by the same analysis in study I (see Fig. 3a.) Panel b depicts brain regions showing a significant main effect of mentalization during the human opponent runs (n=18, qFDR<0.05) masked with regions showing a significant main effect of opponent type (p<0.05) such that activations during human runs are greater than during computer runs. Note that right VLPFC does not appear in this map. Panel c shows the response to outcome interval activations during the human-opponent games (light gray bars) and the computer-opponent games (dark gray bars). All regions but the VLPFC showed significant main effect of opponent type (i.e. human vs. computer) such that signal was greater during the human-opponent compared to the computer-opponent games. (Note: since bilateral regions, such as TPJ and TP, showed the same patterns of activations, graphs presented here are averaged percent signal change of right and left activations.) TPJ, temporoparietal junction; TP, temporal pole, FG, fusiform gyrus; VLPFC, ventrolateral prefrontal cortex; MPFC, medial prefrontal cortex; **p<0.005; *p<0.05; k>50

