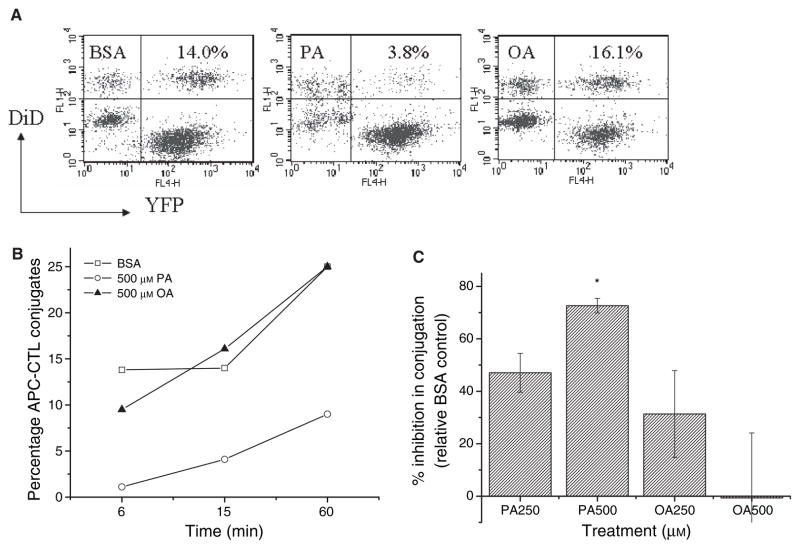
Figure 4.
PA-treatment of APC inhibits conjugation with activated CTL. (A) Sample flow cytometry dot plots of activated CTL, T2-Kb-YFPs, and conjugates. T2-Kb-YFP cells were treated with BSA, PA, or OA for 12 h, peptide pulsed, and mixed with DiD loaded CTL at a ratio of 1/1. Conjugates were identified as YFP+DiD+ after 15 min of incubation at 37 °C. The numbers in the upper right quadrant are the percentage of T cells conjugated. (B) Change in the rate of APC–T-cell conjugation (percentage of T cells conjugated to APC). Data are pooled from two separate experiments. (C) Change in APC–T-cell conjugation (average ± SE) relative to the BSA control from three to four independent measurements at 15 min (*P < 0.01).

