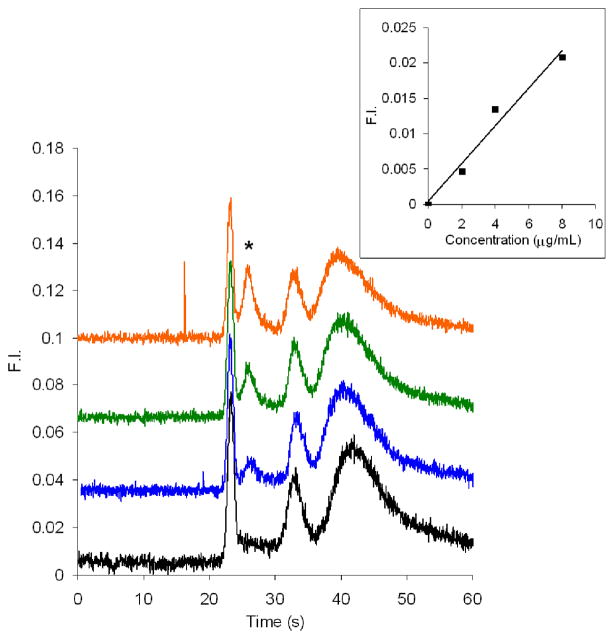
Figure 7.
Microchip electropherograms (offset vertically) of BSA labeled on-chip with CE dye 503. From bottom to top are 0 (black), 2 (blue), 4 (green), and 8 (orange) μg/mL BSA. The gated injection time was 1.0 s, and the BSA peak is denoted with an asterisk. The inset is a plot of BSA concentration vs. peak height. The detection limit (3σ) was calculated to be 1 μg/mL. Standard deviations of the slope and intercept of the linear least squares fit are 3.3×10⁻⁴ and 1.5×10⁻³, respectively.

