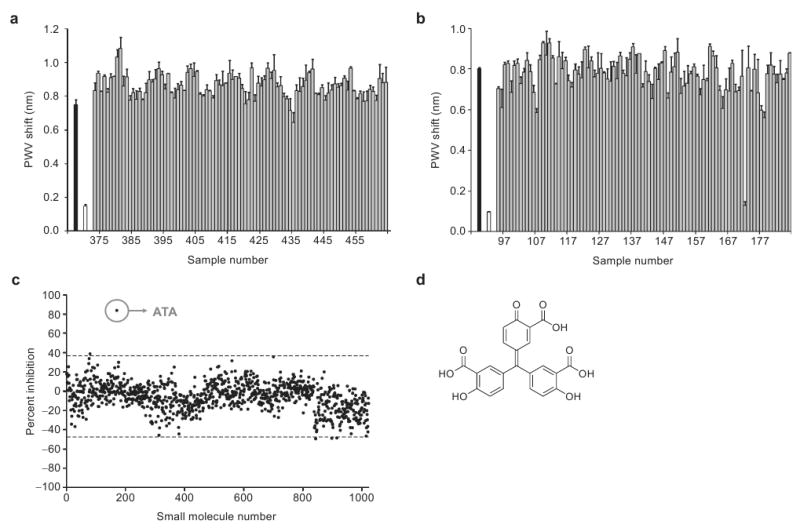
Figure 4.

a) A representative group of ∼1000 compounds screened for their ability to inhibit the AIF–DNA interaction. The black bar represents a control in which there is no compound present; that is, only AIF (3.51 μM) and 1% DMSO are incubated with the blocked DNA-bound biosensor. The white bar represents a control in which AIF was preincubated with 6.25 μM of the nonbiotinylated DNA oligomer prior to addition to the DNA-bound biosensor. The gray bars represent all other wells which contain AIF and 25 μM compounds, none of which show inhibition of AIF–DNA binding. All compounds were referenced to control wells for DMSO, AIF, and small molecule nonspecific binding. b) A group of compounds where ATA was present (sample 172). c) Inhibition data for all compounds screened, where ATA is the only compound out of the ∼1000 screened to show significantly higher inhibition (∼80%). Dotted lines above and below the x-axis represent three standard deviations away from the mean. d) The structure of ATA. All error bars represent the calculated standard error (n = 2).
