Figure 5.

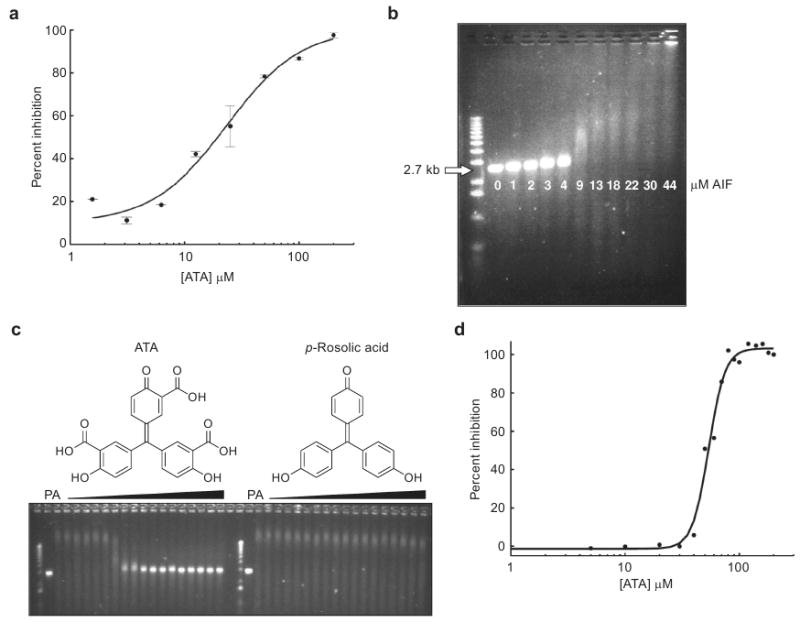
a) Dose–response curve of the inhibition of AIF–DNA binding by ATA as measured by PC biosensor technology. ATA inhibits AIF in this assay with an IC50 of ∼23 μM. b) AIF retards the migration of linearized pUC19 plasmid DNA (2.7 kb) through a 1% agarose gel. The pH dependence is lessened in this assay due to the greater affinity of AIF for larger pieces of DNA (48). c) ATA inhibits AIF in the gel assay while its analogue, p-rosolic acid, does not. “P” represents pUC19 plasmid DNA without any AIF added, while “A” represents pUC19 plasmid DNA incubated with 15 μM AIF. All other wells contain increasing concentrations of ATA or p-rosolic acid (1–200 μM) in addition to pUC19 and AIF. d) Analysis of the ATA–AIF gel in panel c by densitometry reveals that ATA inhibits AIF in this assay with an IC50 of ∼50 μM. Percent inhibition was calculated by using densitometry software (Image J). All error bars represent the calculated standard error (n = 2).
