
Fig. 7.
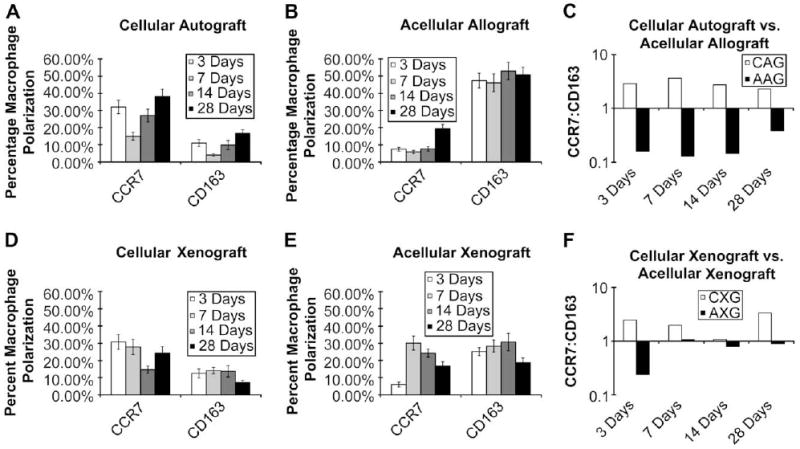
Percentage macrophage polarization at 3, 7, 14, and 28 days post implantation of cellular autograft (A), acellular allograft (B), cellular xenograft (D), or acellular xenograft (E). All values are presented as mean ± SEM. For percent of M1 cells, scaffold type and time were statistically significant (F = 2.93, P < 0.05 and F = 5.26, P < 0.003). For percent of M2 cells, scaffold type was statistically significant (F = 17.22, P < 0.0001). Ratio of the percentage of CCR7+:CD163+ macrophages present in the remodeling cellular autograft (CAG) and acellular allograft (AAG) (C) as well as the remodeling cellular xenograft (CXG) and acellular xenograft (AXG) (F) at 3, 7, 14, and 28 days post implantation. Values above 1.0 are indicative of an M1 type response while values less than 1.0 are indicative of an M2 type response.