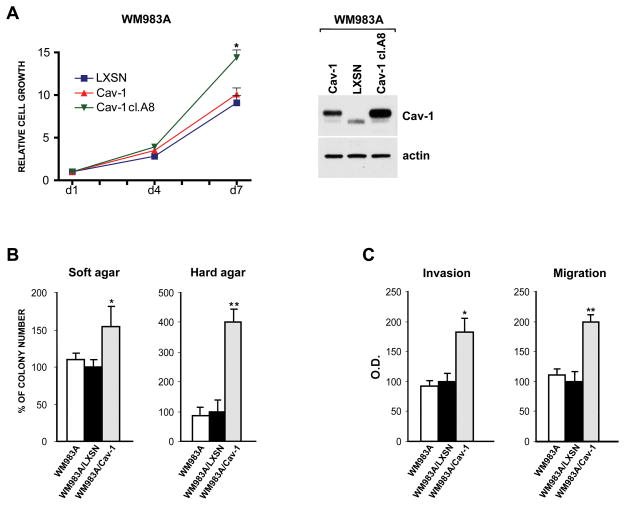
Figure 3. Biological effects of Cav-1 expression.
(A) Growth kinetics (left) evaluated in LXSN-and Cav-1-transduced WM983A bulk populations. Proliferation was also compared with the WM983A/Cav-1 high expressing clone A8. Western blot analysis (right) comparing Cav-1 expression level in the same cells.(B) Evaluation of the number of colonies grown in soft- (0.3%) and hard-agar (0.9%) in WM983A cells. (C) Invasion and chemotaxis analyses upon Cav-1 overexpression. Values, expressed as percentage of WM983A/LXSN cells, are reported as mean±SD of three separate experiments. *p≤0.05; ** p≤0.001.

