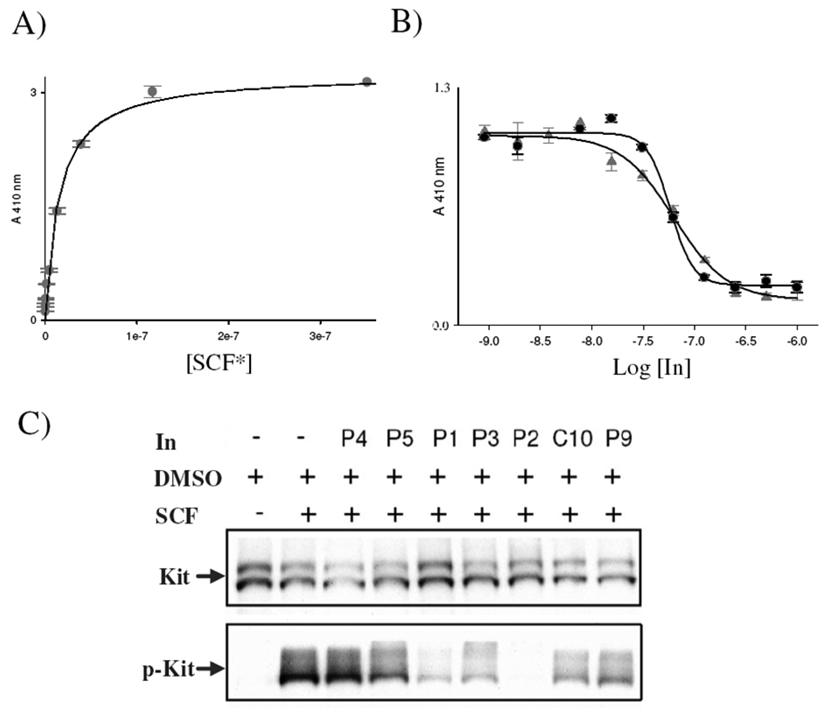
Figure 3.
A) Saturation-binding curve of HRP-labeled SCF (SCF*) binding to ELISA plates coated with the whole extracellular ligand-binding domain of KIT (KD(app) = 16 nm). B) Competition-binding curves for the lead inhibitors (In.) P2 ( ) and P3 (●); KI(app) = 31 and 33 nm, respectively. C) Cell-based assays testing the efficiency of the lead compounds (IC50 < 10 µm) to inhibit SCF-induced KIT phosphorylation. Four compounds (P1–3, C10) strongly inhibited cell stimulation; P2 completely abolished KIT phosphorylation (p-KIT).

