. Author manuscript; available in PMC: 2010 Jan 12.
Published in final edited form as: Chembiochem. 2009 Aug 17;10(12):1955–1958. doi: 10.1002/cbic.200900079

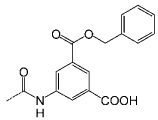
Table 1.

IC50 range estimated by an ELISA assay. Inhibition was tested at five different concentrations (100, 10, 1, 0.1 and 0.01 µm) for each synthetic receptor.

In.[a] R[b] IC50[c]
m]
In.[a] R[b] IC50[c]
m]
P1 graphic file with name nihms152439t1.jpg <0.1 P9 TCPP(Asp)4 <10
P2 graphic file with name nihms152439t2.jpg <0.1 C10 graphic file with name nihms152439t3.jpg <10
P3 graphic file with name nihms152439t4.jpg <0.1 C11 graphic file with name nihms152439t5.jpg <100
P4 graphic file with name nihms152439t6.jpg <1 C12 graphic file with name nihms152439t7.jpg <100
P5 graphic file with name nihms152439t8.jpg <10 C13 graphic file with name nihms152439t9.jpg
P6 graphic file with name nihms152439t10.jpg C14 graphic file with name nihms152439t11.jpg
P7 graphic file with name nihms152439t12.jpg O15–17 graphic file with name nihms152439t13.jpg
P8 graphic file with name nihms152439t14.jpg O18 graphic file with name nihms152439t15.jpg
[a]

Inhibitor;

[b]

modifying groups;

[c]

concentration [µm] that led to more than 50% inhibition of the SCF*–KIT interaction.