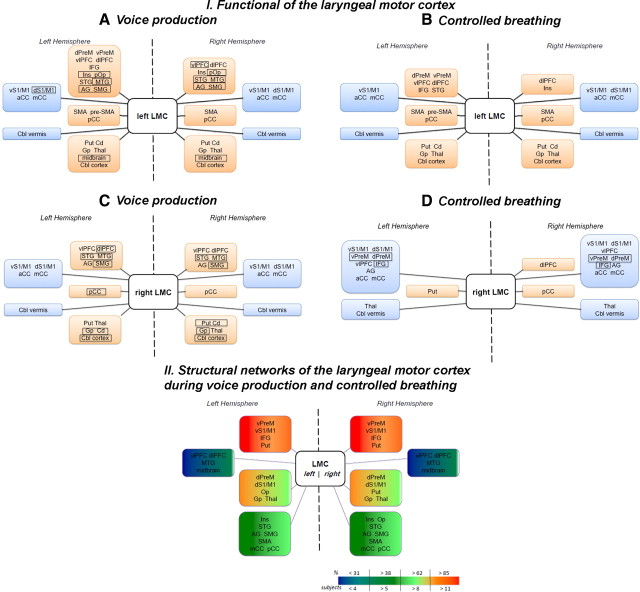
Figure 5.
Block diagrams illustrating the organization of functional (I) and structural (II) networks originating from the left and right hemispheric seeds in the laryngeal motor cortex during production of voluntary voice (combined syllables /iʔi/ and /ihi/) (A, C) and controlled breathing (B, D). I, Brain regions in rectangles indicate the regions showing differences in functional networks between voice and breathing production. Regions included in the orange blocks depict positive connections of the laryngeal motor cortex, while the regions in the blue blocks indicate negative connections of the laryngeal motor cortex. II, Color-coded blocks indicate the probability of a tract passage through a given brain region. The scale represents chance of probability (percentage) of the tracts in the region and the number of subjects in whom those tracts were identified. dPreM, Dorsal premotor cortex; vPreM, ventral premotor cortex; vlPFC, ventrolateral prefrontal cortex; dlPFC, dorsolateral prefrontal cortex; Ins, insula; pOp, posterior operculum; AG, angular gyrus; SMG, supramarginal gyrus; vS1/M1, ventral primary sensorimotor cortex; dS1/M1, dorsal primary sensorimotor cortex; aCC, anterior cingulate cortex; mCC, middle cingulate cortex; pCC, posterior cingulate cortex; Put, putamen; Cd, caudate nucleus; Gp, globus pallidus; Thal, thalamus; Cbl, cerebellum.

