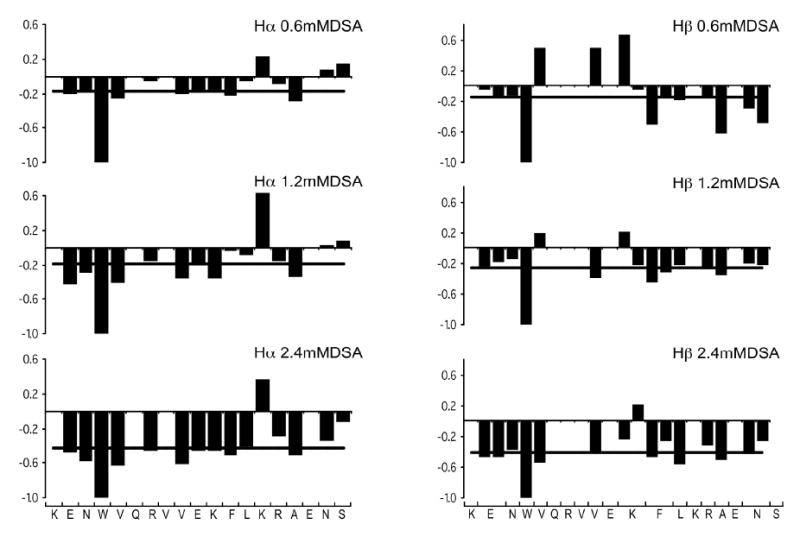
Figure 3.

Effect of 16-DSA on IL-8α. The ratio of 2D-TOCSY crosspeak intensity with and without 16-DSA is plotted along the amino acid sequence at 0.6mM 16-DSA (top), 1.2mM 16-DSA (middle), 2.4mM 16-DSA (bottom), together with the average values at each 16-DSA concentration, represented as a black line, for Hα protons on the left and Hβ protons on the right.
