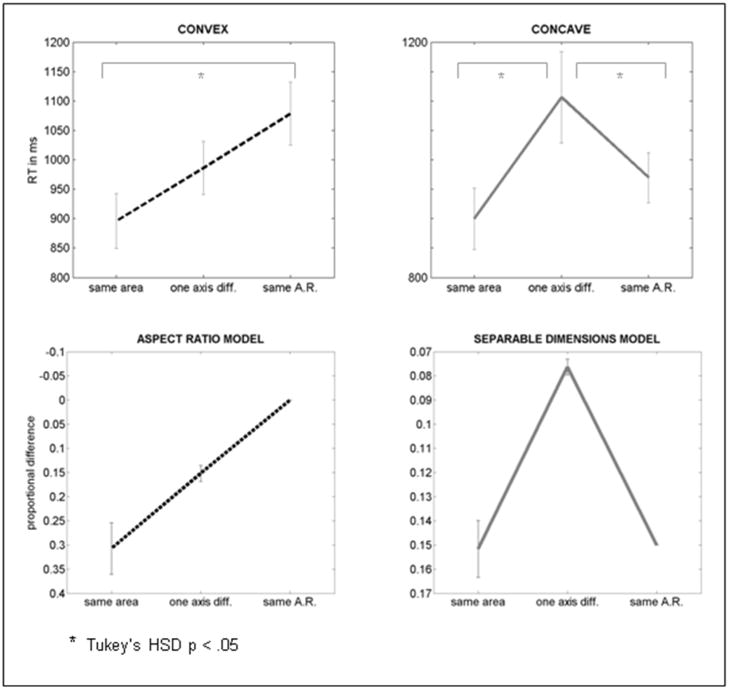
Figure 9.
Top row: mean of individual subjects’ median RTs for Experiment 3. Error bars represent standard error of the mean. Bottom row: differences in modeled shape representations for the three distortion types, based on representing shapes by aspect ratio (left) by a city-block model in which differences were calculated by considering length and width as separable dimensions (right). Error bars represent standard deviations for the set of stimulus dimensions used in the trials of the experiment. Ordinates for the model data have been inverted so that small shape differences compare to higher RT in the behavioral data graphs.

