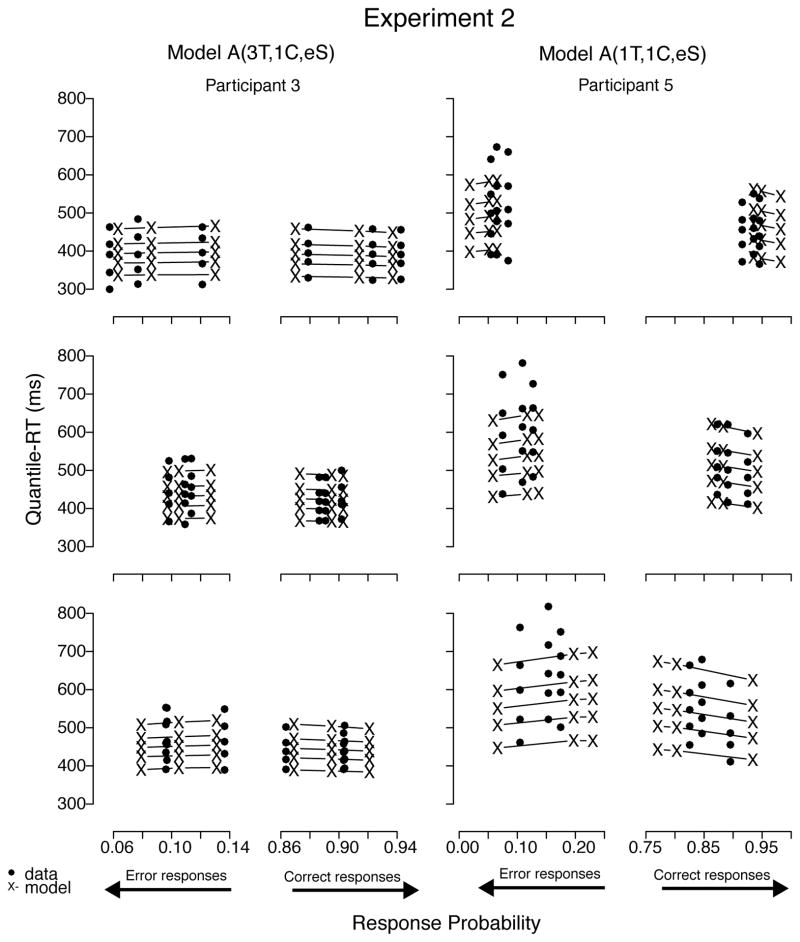
Figure 17.
Quantile-Probability plots for data from Participants 3 and 5 and predictions from the respective best-fitting model in Experiment 2. RT points are plotted in quantile ascending order, from .1 to .9. From left to right, the 3 columns across error responses represent high-, low-, and no-bias conditions, followed by no-, low-, and high-bias data points across correct responses. Model variant label abbreviates the model’s structure: A = accumulator (without decay); T = ter; C = criterion; eS = equal starting point.

