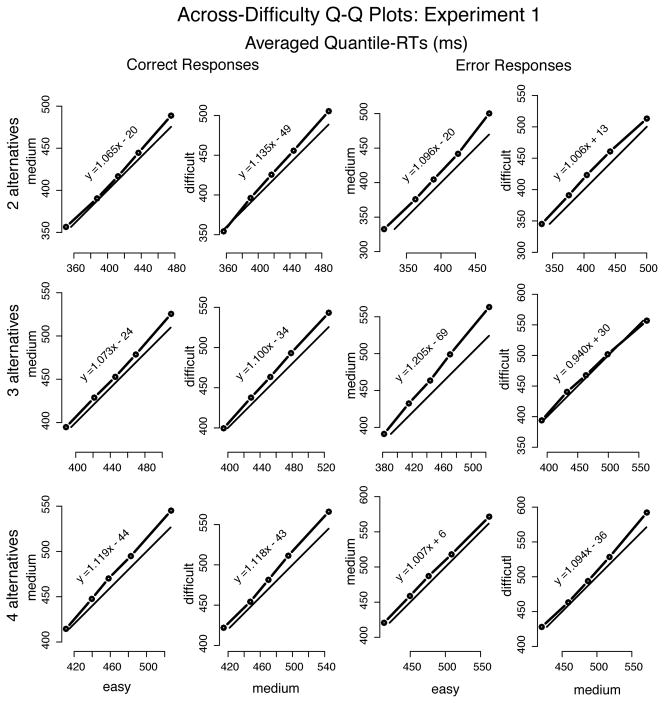
Figure 7.
Quantile-Quantile plots drawn from averaging the individual quantiles computed for each participant in Experiment 1 (represented by the dots connected to the thicker solid lines). The thinner solid lines represent x = y. Equation y = ax + b (a =slope; b =intercept) is the regression-line of y on x—slopes near the unit indicate nearly identical distributions between y and x; slopes greater than the unit show spreading of the tail in y vs. x; and slopes below the unit show spreading of the lading edge of the y distribution in comparison to x. Plots show very little difference in the shape of RT distributions as a function of difficulty, for all numbers of alternatives.

