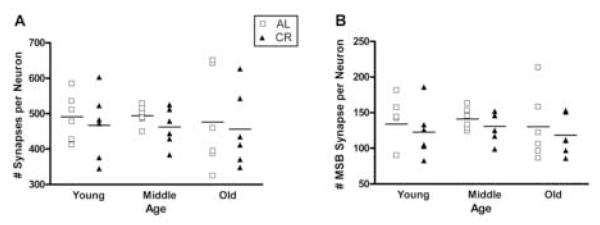
Figure 3.
Scatter plot diagrams of the number of synapses per neuron (A) and the number of MSB synapses per neuron (B) for AL (open squares) and CR groups (filled triangles) at young (10 months), middle (18 months) and old (29 months) ages. The horizontal lines indicate the mean for each group. In no case did the means change as a function of age or diet.

