Fig 2.
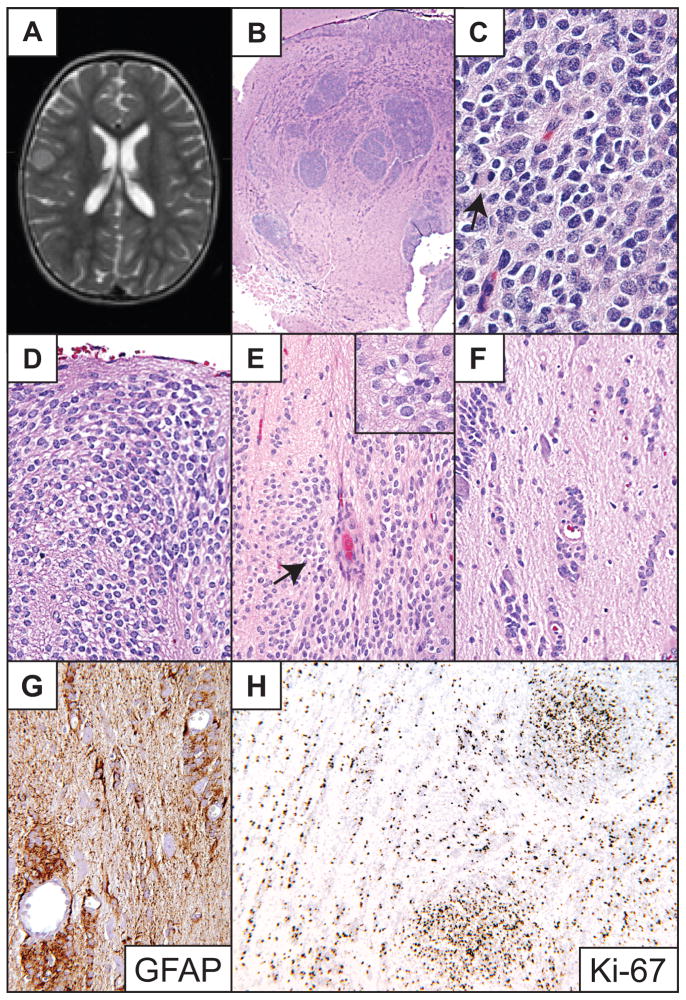
Patient 2. (A) T2-weighted MR image illustrates slightly hyperintense lesion centered in the cerebral cortex. (B) Low-power image of the tumor demonstrates numerous densely cellular nodules and focal disruption of underlying white matter. (C) High-power photomicrograph of the dense tumor cell nodules. A mitotic figure (anaphase) is visible on the left (arrow). (D) The tumor formed subpial mounds of clear epithelioid cells. (E) Both pseudorosettes (arrow) and true rosettes (inset) were present. (F, G) Tumor cells infiltrated freely and along small blood vessels in a non-rosetting pattern, and also along neurons, most strikingly at the periphery of the lesion. (H) The dense tumor cell nodules showed a Ki-67 labeling index of 50 to 80%. Hematoxylin and eosin stains, except (G) and (H), which are GFAP and Ki-67 immunoperoxidase stains, respectively. Original magnifications: (B) 20×; (C) 600×; (D, E inset); 400×; (E–G); 200×; (H) 100×.

