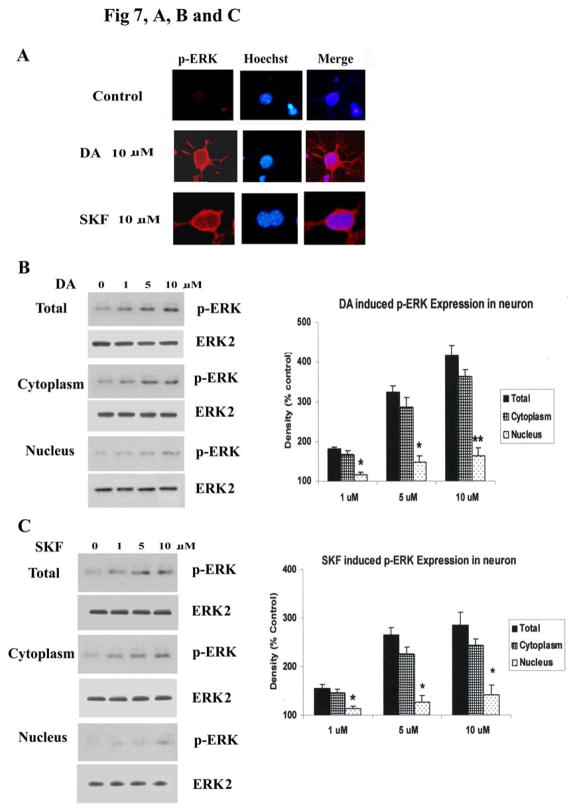
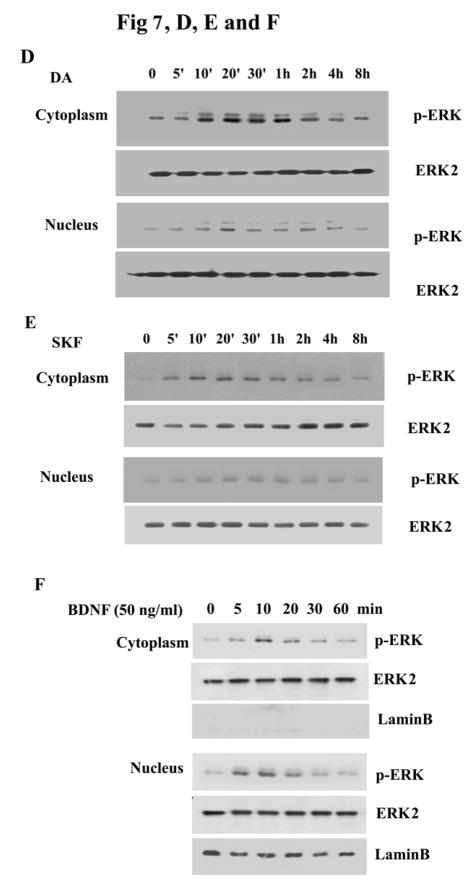
Fig. 7. The subcellular distribution of p-ERK1/2 after treatment with DA and SKF R-38393.
A. Striatal neurons were treated for 20 min with 10 μM of either DA or SKF R-38393, and co-stained for p-ERK (red) and Hoechst (blue) immunoreactivity as described in Experimental Procedures. In panel B and C, p-ERK1/2 expression in cytoplasmic fraction and nuclear fraction was assessed after treatment with 0–10 μM of either DA [B] or SKF R-38393 [C]. In the bar graph, data are expressed relative to control, and represent the average ± S.E.M of three independent experiments (n=3) for each treatment. p<0.05 (*) and p<0.01 (**), represent the result of paired Student’s t test with 4 degrees of freedom for the corresponding cytoplasmic group. Panels D and E show the time-course of p-ERK1/2 expression in cytoplasmic fraction and nuclear fraction after 10 μM of DA [D] or SKF R-38393 [E] treatment. F. Time-course of p-ERK1/2 expression of cytoplasmic fraction and nuclear fraction after 50 ng/ml of BDNF treatment. Cytoplasmic and nuclear extracts were reblotted with anti-LaminB1 antibody (left lane) to demonstrate separation of the nuclear and cytosolic fractions.


