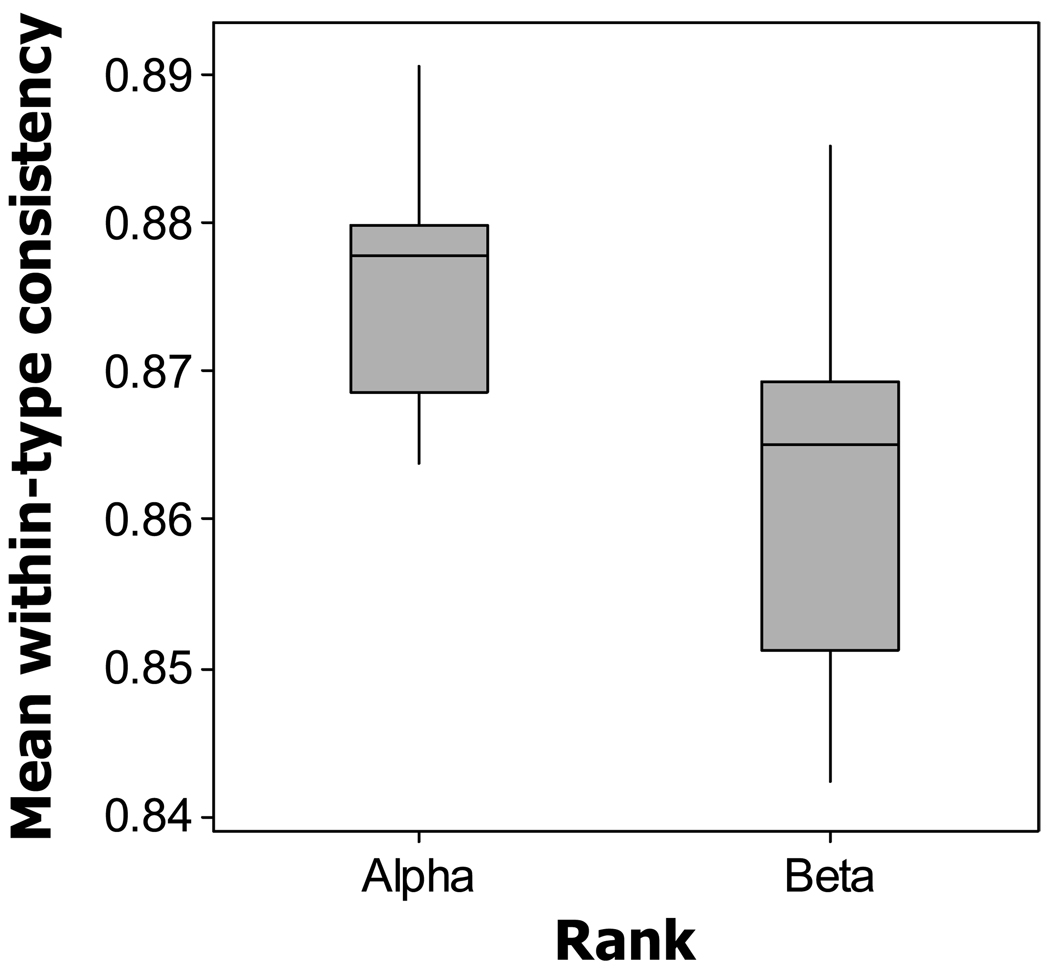
Figure 2.
Mean within-type consistency (measured as the mean spectral cross-correlation coefficient across renditions of the same syllable type) as a function of social dominance. Boxes represent interquartile ranges, horizontal lines mark the medians, and vertical lines represent the general extent of the data. N = 20 alpha males and 12 beta males.

