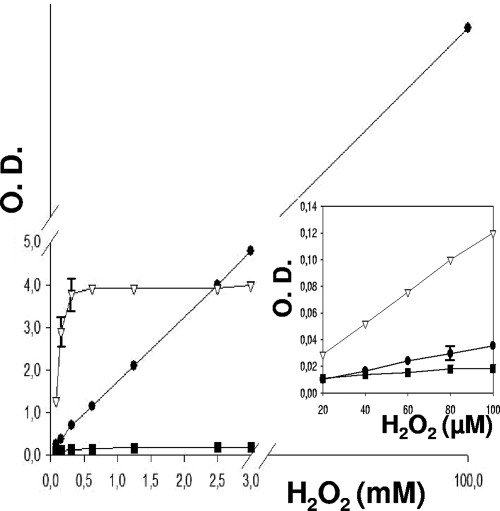
FIG. 1.
Standard curves of the relation between the concentration of hydrogen peroxide and the intensity of color produced by its reaction with the chromophores tetramethylbenzidine (•), o-dianisidine (▪), and DA-64 (▿), catalyzed by horseradish peroxidase (the wavelengths used were 620, 405, and 727 nm, respectively). DA-64 was the most sensitive at low concentrations of hydrogen peroxide (inset). Error bars show standard deviations. O.D., optical density.

