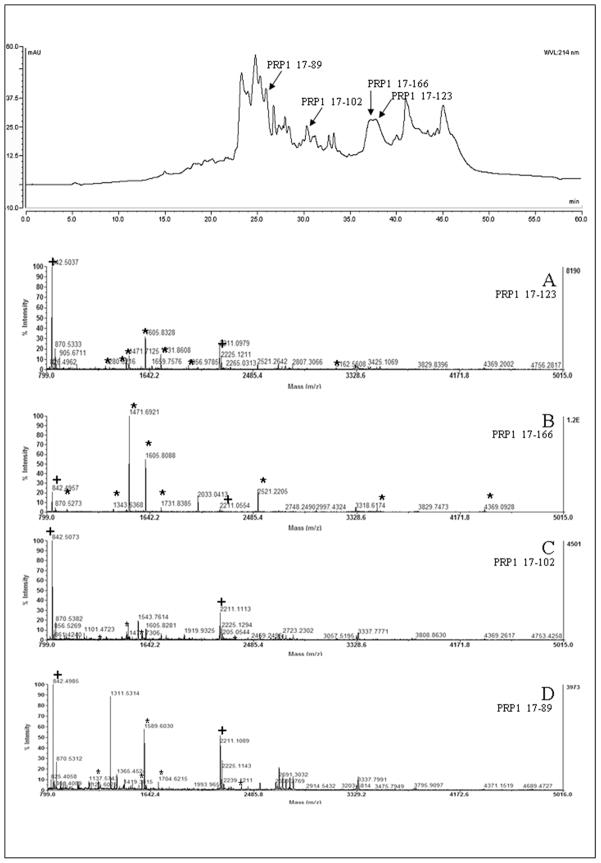
Figure 1.
Upper-Representative UV-chromatogram of a TFA protein extract separation with detection at 214 nm. Lower-. MALDI-MS spectra obtained from fractions eluting at 38 min (A), 36 min (B); 30 min (C) and 25.4 min (D). + indicates the m/z corresponding to the peptides of trypsin autolysis. * indicates the m/z used for protein identification using MASCOT.

