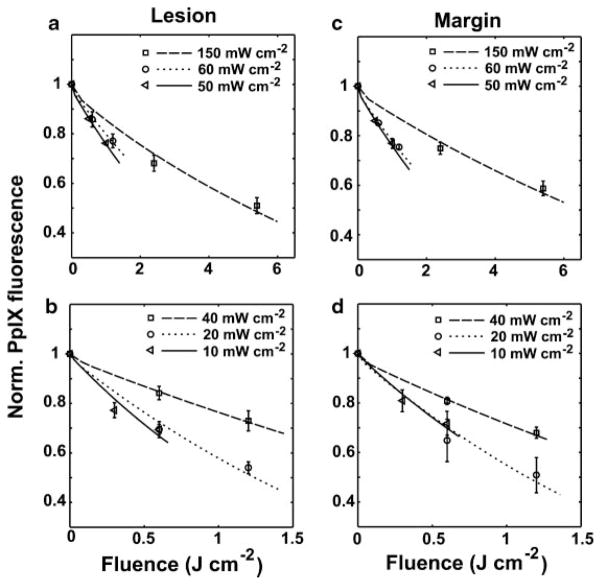
Fig. 3.
Simulations of PpIX photobleaching compared to experimental data at early fluences for lesion and normal tissue margin. a,b: Cases of 50–150 and 10–40 mW cm−2 for lesion, respectively, and (c) and (d) are the cases for normal tissue margin. The averaged ± SD, normalized PpIX bleaching data for different irradiances are represented by symbols. The various line styles are the simulated best-fit bleaching curves for these irradiances at these initial fluences. All of the simulated curves are produced using a set of photophysical parameters related to a 1O2-mediated bleaching mechanism.

