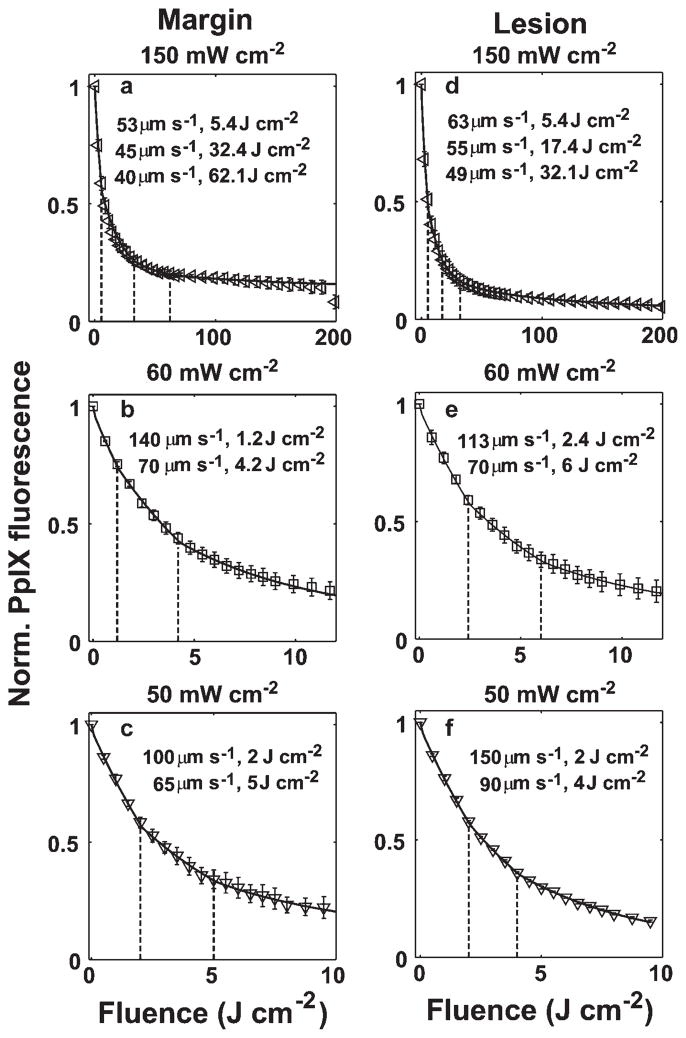
Fig. 5.
Simulations of bleaching curves measured in margin (a–c) and lesion (d–f) for irradiances of 50–150 mW cm−2. The dashed vertical lines indicate the fluences at which blood velocity changes were initiated. The figure legend shows the reduced velocity at selected fluences. The initial blood velocity was 300 μm second−1.

