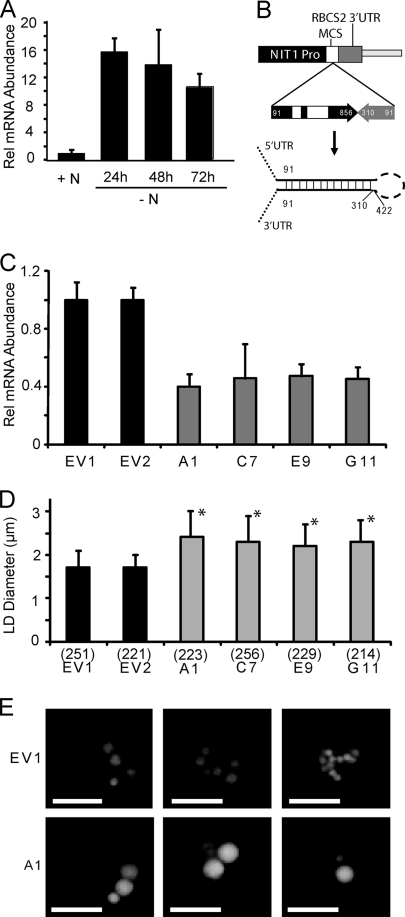
FIG. 4.
Induction and RNAi suppression of MLDP gene expression. (A) Relative abundance of MLDP mRNA normalized to RACK1 (CBLP) in wild-type dw15 cells grown in medium with 10 mM NH4+ (+N), or dw15 cells switched to and grown in medium with no NH4+ (−N) for 24, 48, or 72 h measured by quantitative RT-PCR. Data are expressed as fold changes compared to the +N growth condition, which is given a value of 1. The standard deviation of three biological repeats, each done in triplicate, is shown. (B) Diagram showing the MLDP-RNAi construct designed with the NIT1 inducible promoter (Pro) of vector pNITPRO1 driving the expression of an MLDP genomic inverted repeat (numbers indicate base pairs from predicted 5′ UTR), and the predicted transcribed RNA hairpin product. (C) QRT-PCR analysis of MLDP mRNA levels in two empty vector control lines (EV1 and EV2), and four MLDP-RNAi lines isolated from four independent transformation events (A1, C7, E9, G11). Data are represented as percent change compared to EV1 and normalized to RACK1 as in panel A. Three replicates were averaged and standard deviation is shown. (D) Analysis of apparent lipid droplet diameter in empty vector controls and MLDP-RNAi lines described in (C). The average and standard deviation are shown for n (indicated in parentheses below each bar) lipid droplets counted, and cell lines are marked with an asterisk, for which P < 0.01 compared to EV1 in a two-tailed Student t test. (E) Fluorescent micrographs of representative cells of lines EV1 and A1 stained for lipid droplets with Nile red.

