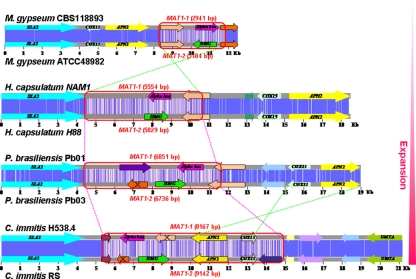
FIG. 2.
Comparing the MAT locus of dermatophyte and dimorphic fungi. A DNA sequence alignment of the opposite MAT loci and flanking genes of M. gypseum, H. capsulatum, C. immitis, C. posadasii, and P. brasiliensis was prepared by using CLUSTAL W. MAT locus genes are represented by arrows outlined with black lines. Homologous genes are represented by the same color. The DNA sequence similarity between two opposite MAT loci is represented in blue, and darker colors indicate greater sequence similarity. The main events during the MAT locus evolution of these fungal species are indicated by broken red lines (expansion) and crossed broken green lines (inversion). Genes present in only one idiomorph are marked with black crosses.

