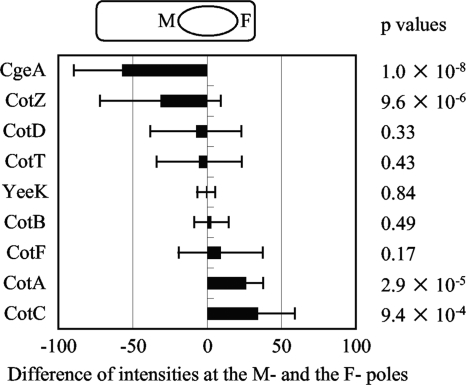
FIG. 4.
Difference between fluorescence intensities at forespore poles. The fluorescence intensity of the indicated GFP-fused protein at the M-pole peak was subtracted from that at the F-pole peak. Bars indicate averages and error bars indicate standard deviations of results for 20 to 30 forespores. The diagram at the top of the graph indicates that left and right bars represent higher intensity at the M-pole and the F-pole, respectively. Two-tail P values for fluorescence intensities at M- and F-poles of each strain are shown to the right.

