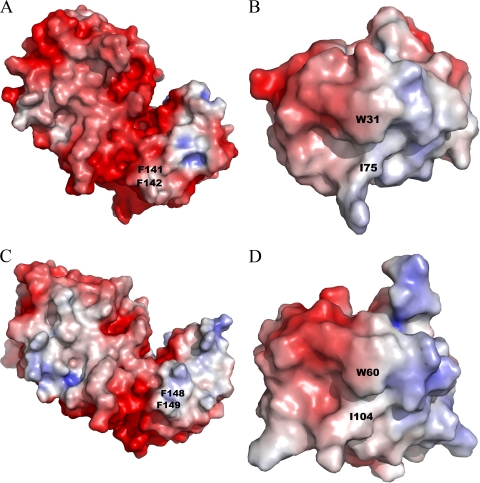
FIG. 7.
Electrostatic potentials of TrxR and Trx from E. coli (A and B, respectively) and D. radiodurans (C and D, respectively), calculated by APBS software (4). Positively and negatively charged areas are colored in red and in blue and contoured at −5 kBTe−1 and +5 kBTe−1, respectively. Key residues of the TrxR-Trx complex interface are shown on the diagram. The overall shapes of the Trx-binding sites differ between the two TrxR proteins, but there are only small differences in the electrostatic potentials. The figures were generated with PYMOL (9) using E. coli TrxR, E. coli Trx, and D. radiodurans TrxR coordinates (PDB accession no. 1TDE, 2TRX, and 2Q7V, respectively). The D. radiodurans Trx figure was generated using the D. radiodurans Trx homology model.

