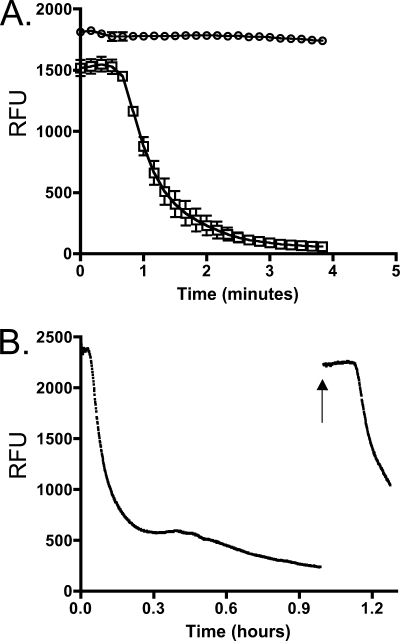
FIG. 2.
Development of flavin reduction assay by S. oneidensis. (A) MR-1 cells were washed in minimal medium and injected to an anaerobic cuvette containing minimal medium and riboflavin as the electron acceptor and given either 18 mM lactate (□) or no carbon source (○). Relative fluorescence units (RFU) were measured over time as described in the text. Error bars represent standard deviations from triplicate experiments. (B) MR-1 cells were examined as described for panel A, only a lower cell density was used. The arrow indicates when the culture was exposed to the atmosphere and vortexed for ∼10 s. Culture then was resealed and readings were resumed. This figure is representative of three independent experiments.

