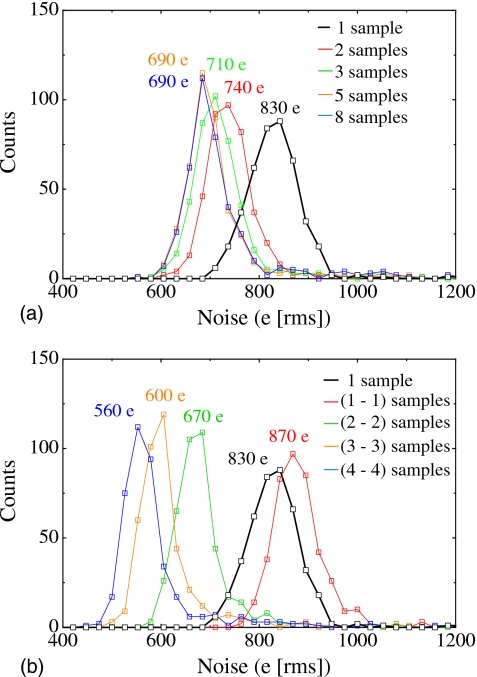
Figure 13.
Distributions of pixel temporal additive noise for a block of 33×13 pixels from PSI-3. The results were obtained using various sampling techniques involving one or more samples acquired following a single pixel reset. (a) Distributions corresponding to a single sample (“1 sample”) and the average of multiple samples (“2 samples,” etc.) (b) Distributions corresponding to a single sample (“1 sample”) and to results obtained using correlated double sampling involving the subtraction of two samples [“(1-1) samples”] as well as the subtraction of the averages of two or more samples [“(2-2) samples,” etc.].

