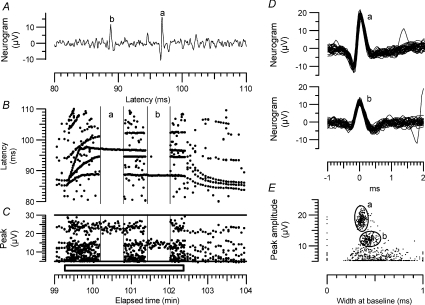
Figure 1. Spike discrimination in multiunit recordings.
A, part of a single sweep in a multi-unit recording following electrical stimulation. The larger spike is labelled ‘a’ and the next largest ‘b’. Sweep recorded at 101 min. B, raster plot showing all peaks above 5 μV in amplitude during 5 min of recording, including a 3 min period in which stimulation rate was increased from 0.25 Hz to 2 Hz (indicated by bar at the bottom). Individual units firing consistently in response to the stimulus give rise to continuous lines in the raster plot. Recording during 36 s periods marked ‘a’ and ‘b’ indicate periods when recording was filtered to select spikes ‘a’ and ‘be respectively. C, peak amplitudes of all points in the raster plot, showing overlap of amplitudes. D, superimposed waveforms of all spikes in the periods marked ‘a’ and ‘b’ in parts B and C. E, plot of peak amplitude vs. width at baseline for all points in the recording, before filtering, showing clustering of points corresponding to the largest fibres. The ellipses ‘a’ and ‘b’ were drawn to fit the distribution of points (not shown) for the lines in the raster plot corresponding to each of the two largest peaks. These ellipses were subsequently used to filter the recording during the two 36 s periods indicated in parts B and C. (N.B. a 4 kHz low-pass filter frequency was used in the original recording, but a 2 kHz cut-off in the re-analysis, which is why the peak amplitudes are larger in C than in D and E).

