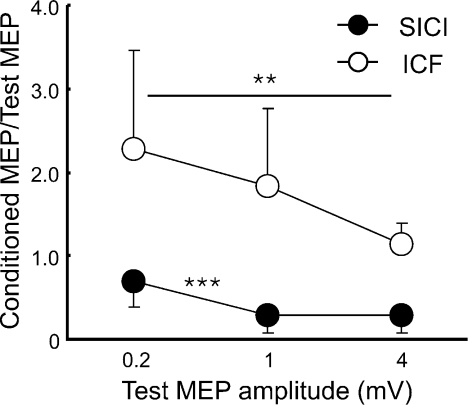
Figure 1. Effects of different test stimulus intensities on short interval intracortical inhibition and intracortical facilitation (Experiment 1).
Data from 11 subjects. The abscissa indicates the MEP size induced by test stimulus (S1) alone. The ordinate indicates the amplitude of conditioned MEP (CS3/CS10–S1 paired-pulse) expressed as a ratio of the MEP amplitude induced by S1 alone. Ratios less than 1 indicate inhibition and ratios greater than 1 indicate facilitation. Filled circles indicate short interval intracortical inhibition (SICI) and open circles indicate intracortical facilitation (ICF). **P < 0.01, ***P < 0.001, comparing different S1 intensities.

