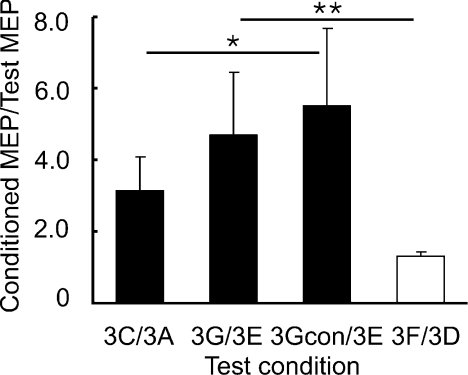
Figure 5. Changes in short interval intracortical facilitation in the presence of short interval intracortical inhibition with reversed stimulation current (Experiment 3).
Means and standard deviations (n= 7) of the first phase of short interval intracortical facilitation (SICF-1) under different experimental conditions. SICF was normalized as a ratio of conditioned MEP to the test MEP. 3C/3A indicates SICF alone. 3G/3E indicates SICF in the presence of short interval intracortical inhibition (SICI) with same test MEP size as 3C/3A. 3Gcon/3E indicates SICF in the presence of SICI, but with adjusted S2 intensity (motor threshold in the presence of CS3). These three ratios are shown in filled columns and they are matched by test MEP size. Open columns represent 3F/3D (SICF alone, but with adjusted S1 intensity). 3F/3D and 3G/3E used same S1 intensity. *P < 0.05, **P < 0.01, comparing SICF under different experimental conditions. SICF-1 is increased in the presence of SICI with reversed (anterior–posterior) stimulation current.

