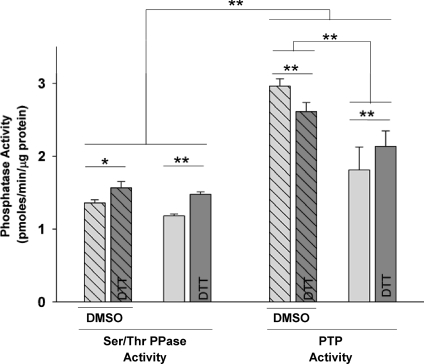
Figure 1. Phosphatase activities in matched, untreated control tissues.
Hatched bars: data from controls of DMNQ experiments in which the tissues were exposed to the 3 mm DMSO solvent. Non-hatched bars: data from controls of H2O2 experiments in which tissues were not exposed to any solvent. Light grey bars: supernatants without DTT treatment. Dark grey bars: duplicate, matched supernatants treated with DTT prior to the phosphatase assays. Statistical differences from repeated measures multi-way ANOVA and contrasts between DTT and non-DTT treated supernatants (n= 5–6 in each group; **P < 0.01, *P < 0.05).

