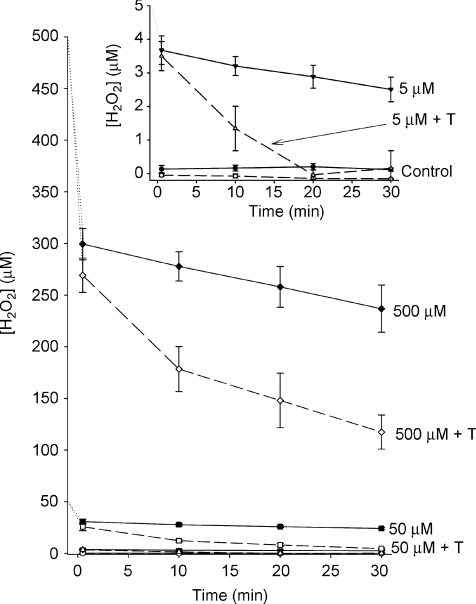
Figure 4. Decay of [H2O2] over time in the tissue baths.
Inset: expanded scale to demonstrate measurements in control tissue (no H2O2) and with 5 μm H2O2. Dashed lines are baths containing muscle tissue; continuous lines are baths without tissue. All measurements were compared against standards using Amplex Red fluorescence as the detection system (n= 4).

