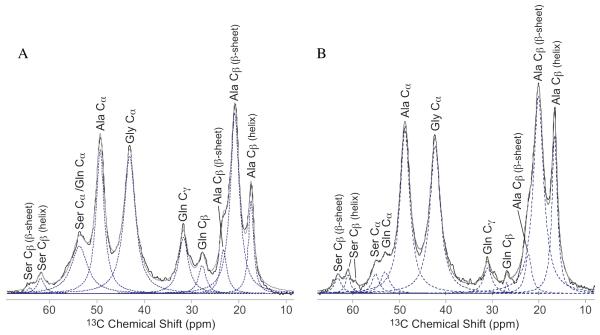
Figure 4.
Aliphatic region from fully relaxed 13C DD-MAS NMR spectrum of water wetted N. clavipes (A) Ma and (B) Mi silk. The Ser Cβ fit was used to determine the percentage of Ser incorporated into a β-sheet or helical conformation. The Ala Cβ in both the Ma and Mi silk were fit and compared to carbonyl fits. This provided a self-consistent check for the percentage of Ala in a β-sheet or helical conformation extracted from the carbonyl fits. The original data is in black, the sum of the fits are in grey, and the individual fits are dotted lines.

