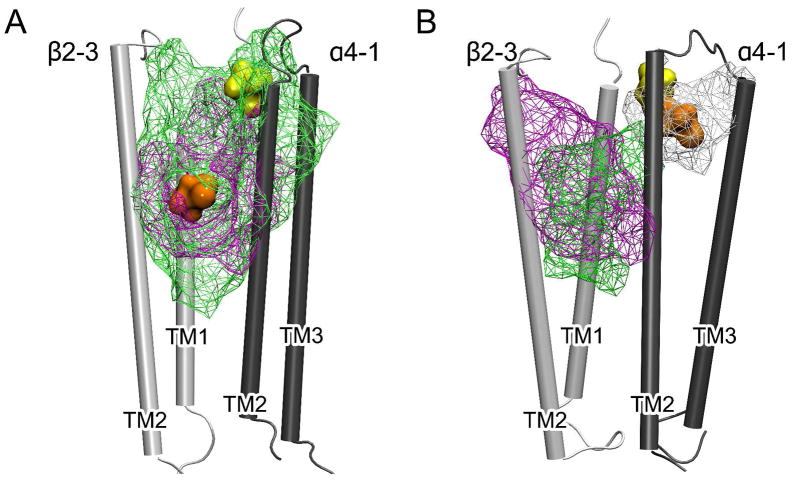
Figure 2.
The cavities at the interface of β2-3 (white) and α4-1 (gray) subunits in the closed- (A) and open-channel (B) models. The cavities are viewed from inside the pore, presented in green wire frame for the control systems and in magenta and white wire frame for the halothane systems. For clarity, only parts of the α4-1 and β2-3 TM domains are shown. Halothane at the beginning and in the last 5-ns of the 20-ns simulations are shown in yellow and orange spheres, respectively. The structures averaged over either the first or the last 500-ps simulations were used for cavity identification.

