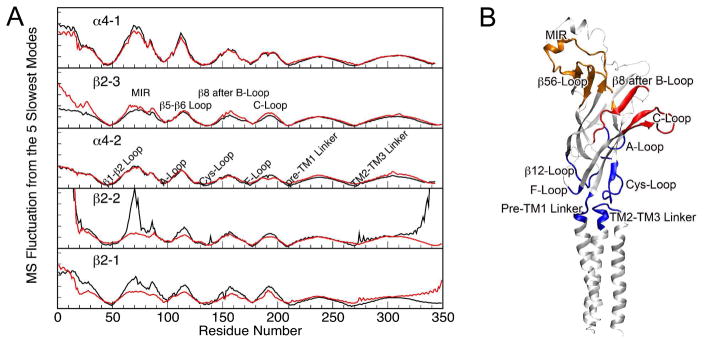
Figure 3.
(A) Mean-square fluctuation (MSF) of individual subunits of the closed-channel α4β2 nAChR in the control (black) and halothane (red) systems. The data were generated using the five slowest normal modes of the GNM analysis on the pentameric structure at the end of the 20-ns simulations. MSF was reduced in certain regions of the extracellular (EC) domain in the presence of halothane. (B) A snapshot of the α4-2 subunit with color-coded maxima (red and orange) and minima (blue) of the MSF shown in (A).

